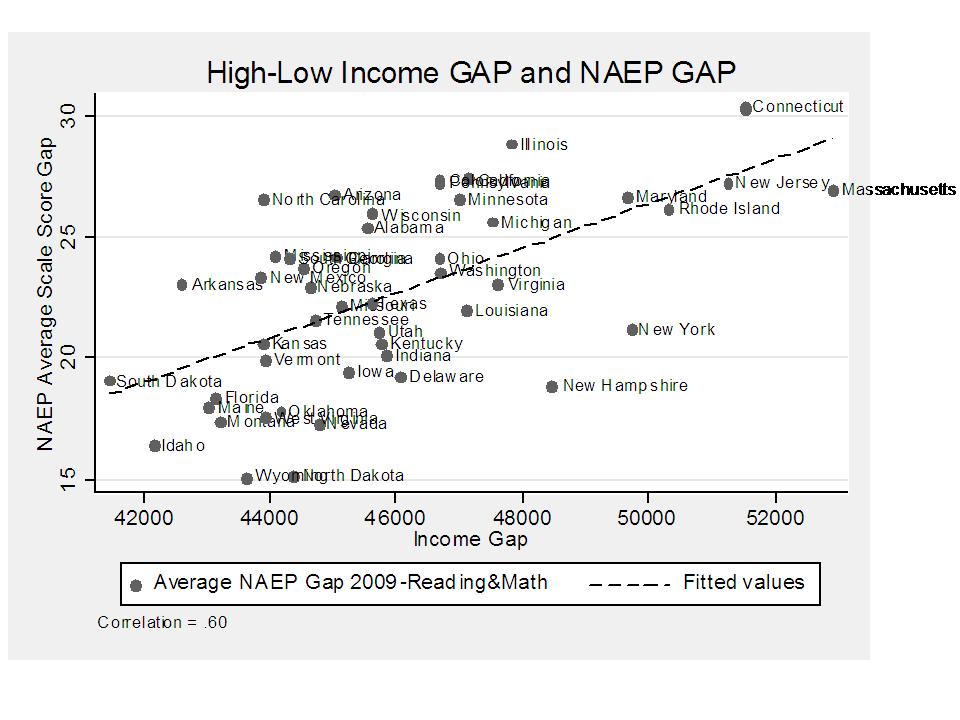
What this illustrates is the correlation of the size of the gap between the income of families above and below the cutoff for reduced lunches and the size of the corresponding achievement gap. Rhode Island is high in both categories, although slightly below trend (i.e., smaller achievement gap).
No comments:
Post a Comment